MONITORING LINUX SERVERS – THE ULTIMATE BEGINNER’S GUIDE
- Server Administration
- 2,847 views
- Vucebte Q.

Monitoring Linux servers – the ultimate beginner’s guide
Server monitoring is one of the most important tasks of a Linux system administrator. Even the most stable server will eventually experience spikes of traffic, high CPU load and other such events that require manual intervention.
This is why setting up a reliable monitoring system is critical, especially when you have to manage a large number of servers.
Having a good system in place will not only alert you of any problems, but also collect valuable data that you can use to tweak your services in order to improve availability and performance.
LINUX MONITORING TOOLS
Many monitoring options are available in Linux, from the simplest command-line tools and scripts to extremely powerful enterprise platforms.
There is no ideal alternative, so you should choose a solution based on your specific needs, such as the number of services and parameters that you want to monitor or the way data is presented.
On our blog, you can already find articles on how to setup services like Monit or the dedicated network traffic monitoring tool Ntoping. Another very popular tool for single-server statistics is Netdata.
In this guide, we will install and configure Nagios and Prometheus on a CentOS 7 server. These tools are very powerful and achieve slightly different purposes, so they can be complementary. Setting them up is a valuable experience for a sysadmin beginner and demonstrates the basics of all monitoring systems.
You can think of Nagios and Prometheus as complementary services. Nagios is an extremely well-established tool for monitoring services. If you want to be alerted when Apache is down on your server, Nagios is a proven way of accomplishing that.
Prometheus, on the other hand, specializes at monitoring and recording time series data from a server. This can include performance data such as load averages, IOwait, and others. If you want a historical account of how good/badly your server has performed, a Prometheus instance will be just what you’re looking for.
INSTALL NAGIOS CORE
For the purpose of this tutorial, we will assume that you’re running the latest version of CentOS 7 with all packages updated and SELinux either disabled or in permissive mode.
Start by installing the pre-requisites for Nagios:
yum install –y gcc glibc glibc–common wget unzip httpd php gd gd–devel perl postfix |
The next step is to download the latest version of Nagios Core from their official Github account, we will use the /tmp folder:
1 | cd /tmp<br>wget –O nagioscore.tar.gz https://github.com/NagiosEnterprises/nagioscore/archive/nagios–4.4.3.tar.gz |
After the download completes, unpack the archive and compile Nagios Core:
tar xzf nagioscore.tar.gz<br> cd nagioscore–nagios–4.4.3<br> ./configure<br> make all |
The Nagios service needs a user and group, we will also add the default apache user to this group:
make install–groups–users<br>usermod –a –G nagios apache |
Install binaries, CGI scripts, HTML files and configure the daemon for the service:
make install<br>make install–daemoninit |
These scripts also provide helpful information about the next steps in the installation process, here is for example the output of the make install command:
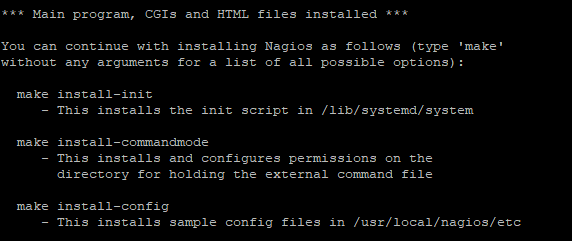
Enable the Apache webserver, so that it starts automatically at boot:
1 | systemctl enable httpd |
The next step is to setup the external command file for Nagios:
1 | make install–commandmode |
Nagios will not start if no configuration files are detected; the easiest workaround is to install the sample configuration files provided, since you can always modify them later:
1 | make install–config |
Sample configuration files are also available for the webserver, install them as well with this command:
1 | make install–webconf |
Apache listens on the port 80 by default, so this port has to be opened in the local firewall in order to allow external access to the web interface. In CentOS 7.x, firewall settings are configured using the firewalld service:
1 | firewall–cmd —zone=public —add–port=80/tcp<br>firewall–cmd —zone=public —add–port=80/tcp –permanent |
Create an Apache user account to secure the web interface, we’ll name it nagiosadmin in this example but you can choose any other name. You will be prompted to enter a password when you run the command:
1 | htpasswd –c /usr/local/nagios/etc/htpasswd.users nagiosadmin |
Nagios Core is now installed and you could start the service, but it will not be fully functional and will display several errors on screen. This is because Nagios plugins have to be installed in order for the service to work properly.
The plugins also have a number of pre-requisite packages:
1 | yum install –y gcc glibc glibc–common make gettext automake autoconf wget openssl–devel net–snmp net–snmp–utils epel–release<br>yum install –y perl–Net–SNMP |
Go back to the tmp folder and download the latest nagios-plugins source file:
1 | cd /tmp<br>wget —no–check–certificate –O nagios–plugins.tar.gz <a href=“https://github.com/nagios-plugins/nagios-plugins/archive/release-2.2.1.tar.gz”>https://github.com/nagios–plugins/nagios–plugins/archive/release–2.2.1.tar.gz</a> |
Unpack the archive, navigate to the proper folder, then compile and install the plugins:
1 | tar zxf nagios–plugins.tar.gz<br>cd nagios–plugins–release–2.2.1<br>./tools/setup<br>./configure<br>make<br>make install |
Everything should be in order now, so we can start the services, the first is the web server:
1 | systemctl start httpd |
The same command is used to start the actual Nagios monitoring service:
1 | systemctl start nagios |
Nagios is now fully operational, you can access the web interface in your browser by navigating to:
1 | http://<your IP or domain>/nagios/ |
In order to login, you’ll be prompted to enter the credentials for the user created during the installation process (nagiosadmin in our example).
The web interface should look like this:
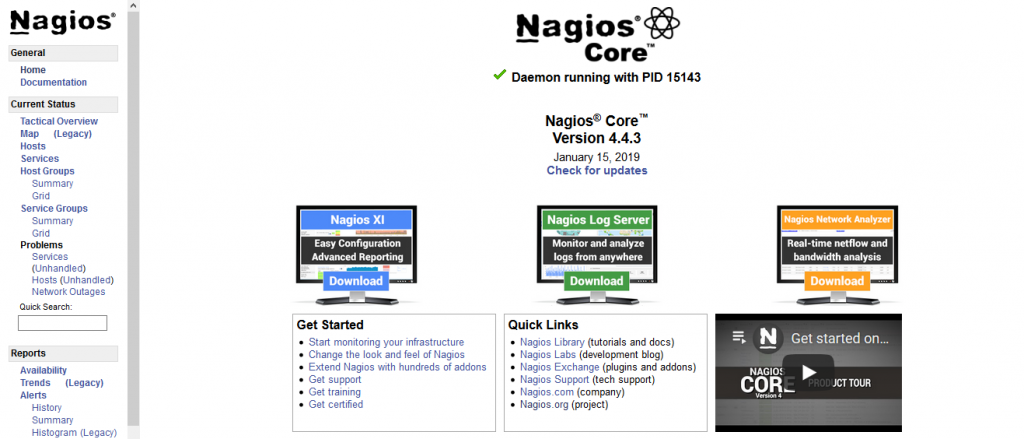
Nagios is a very powerful and versatile system that can be configured in multiple ways. You can use it to monitor all the servers in your infrastructure but for now only the local host has been added.
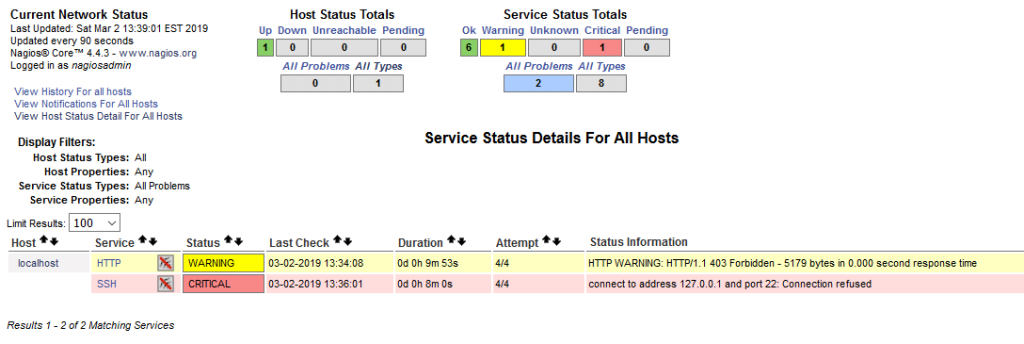
Let’s check its status quickly by clicking on Hosts in the menu on the left, then on localhost. Everything looks OK here but you’ll also notice a Problems section in the left menu, click on Services under it.
In this example, two problems are reported one of them being critical. Both are normal, the HTTP warning is triggered because access to the webpage is forbidden without a password, while the SSH alert appears because this server uses a custom port for the service, instead of the default 22 one.
Let’s modify this check quickly to monitor the actual port used by SSH on the server. Services can be configured by editing configuration files in the command line, which allows a variety of customization options.
We’ll do it from the web interface in this case. Click on Configuration under System in the left menu, select Services, and then click on check_ssh. Modify the command so that it looks like this:
1 | check_ssh! –p <your custom port> |
The script should now monitor the correct port and the alert will disappear after the next check.
Even the free version of Nagios is a very effective monitoring platform. We will not describe how to configure it in this article, but there are many tools available that make it an easy task, and you can find extensive online documentation on this topic.
Hundreds of addons can also be installed to extend the functionality of Nagios and monitor a large number of applications.
The look of the web interface is highly customizable as well and the open source community that supports this project is very active, so new addons, plugins and themes are released every day.
INSTALL AND CONFIGURE PROMETHEUS
While Nagios is a solid monitoring system, Prometheus offers a different set of functions that make it more suitable for some use cases.
The main advantage of Prometheus is that it uses a flexible query language, allowing the data to be processed in detail. It is also built to work with all major cloud and container platforms and supports service discovery, so it is perfect for dynamic and scalable server environments.
Promotheus can be installed in multiple ways; you can compile it from source, download a binary, configure the official yum repository or use a Docker image. In this article, we will use the pre-compiled binary file.
We will install the service in the /opt folder, so download the latest version of the binary there:
1 | cd /opt<br>wget <a href=“https://github.com/prometheus/prometheus/releases/download/v2.7.2/prometheus-2.7.2.linux-amd64.tar.gz”>https://github.com/prometheus/prometheus/releases/download/v2.7.2/prometheus–2.7.2.linux–amd64.tar.gz</a> |
Extract the archive in this folder:
1 | tar –zxvf prometheus–2.7.2.linux–amd64.tar.gz |
Create a symbolic link to the folder, in order to have a shorter command path:
1 | ln –s prometheus–2.7.2.linux–amd64 prometheus |
Running services under the root user is a security risk, so we will setup a dedicated Prometheus user and change file ownership:
1 | useradd prometheus<br>chown –R prometheus:prometheus /opt/ prometheus–2.7.2.linux–amd64/ |
In order to manage the service easier, we will run it under systemd. Create the /etc/systemd/system/prometheus.service file with your favorite text editor and add these lines:
1 | [unit]<br> Description=Prometheus Server<br> After=network–online.target<br>[Service]<br> User=root<br> Restart=on–failure<br> ExecStart=/opt/prometheus/prometheus —config.file=/opt/prometheus/prometheus.yml<br>[Install]<br> WantedBy=multi–user.target |
A sample prometheus.yml file is already provided in the default installation and configured to monitor the local server.
Before starting the service, make sure that port 9090 is opened in the firewall.
Reload the system daemon to make it aware of the new service, then start Prometheus and enable it at boot. Even if the command throw no errors, verify the service status to make sure that everything is in order:
1 | systemctl daemon–reload<br>systemctl enable prometheus<br>systemctl start prometheus<br>systemctl status prometheus |
The local installation is now complete, so you can open the web console in your browser:
1 | <a href=“http://%3cyour”>http://<your</a> IP or domain>:9090 |
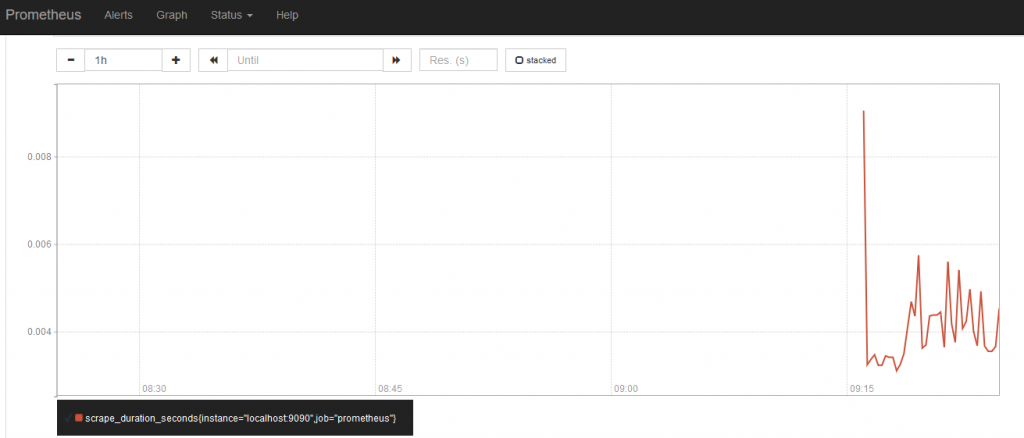
You will notice that this web interface looks completely different from the one of Nagios and no monitoring data seems to be available. The data is actually there, but you have to execute queries in order to view it.
To test that the service works properly, let’s run a simple query. In the Expression field, paste the string scrape_duration_seconds and click on Execute. Click on the Graph tab and you’ll notice that metrics are being processed:
NODE EXPORTER AND GRAFANA
Monitoring only your local server is not very useful. Prometheus collects data from other servers using an agent named Node Exporter that must be installed on every machine.
Node Exporter uses a different port (9100) that must be allowed in the local firewall.
We will not describe the agent installation in detail, since it is very similar to the one for Prometheus. Follow the same steps, download the file in the /opt folder, extract it, assign the files to the Prometheus owner, create a system service then start it.
Here is the link to the latest version available at the moment, but new ones will be released in time: https://github.com/prometheus/node_exporter/releases/download/v0.17.0/node_exporter-0.17.0.linux-amd64.tar.gz
You will now have to configure Prometheus to monitor the remote machine.
Edit the /opt/prometheus/prometheus.yml file on the main Prometheus server and add a target at the end for every other server that runs Node Exporter.
We will call them “remoteservers” in this example but you can choose any name you want as long as you add the correct IP for every server in the target section:
1 2 3 | – job_name: ‘remoteservers’<br> static_configs:<br> – targets: [‘server1_IP:9100’, ‘server2_IP:9100’] |
The formatting rules of yaml files are notoriously strict, so make sure that all spacing and indentation is correct. Restart the Prometheus service in order to load the new configuration file; if it refuses to start you’ll have to check the yaml syntax:
1 | systemctl restart prometheus |
You have probably noticed that Prometheus lacks a user-friendly visualization dashboard, like the one provided by Nagios.
However, it is easy to create an even richer graphical interface by integrating it with Grafana.
We have already described in an older article how to install and setup Grafana on a CentOS 7 server. Grafana must be configured to accept data from Prometheus, which is very easy.
In Grafana’s web interface, click on Data Source, then on Add New. Choose Prometheus as the data type and enter the correct url and port of the server.
Click on the Dashboards menu and import the ones for Prometheus, the monitoring graphs for every node will be available now.
Grafana and Prometheus have many other powerful features that can be configured, check the online documentation for examples and tutorials. You can import additional dashboards, configure alerts, group servers based on certain parameters, setup automatic service discovery and so on.
FINAL CONSIDERATIONS
Having a solid system in place for monitoring and alerts can greatly simplify the job of a system administrator.
When the essential metrics from your servers are collected at all times, you can react quickly to any problems as well as investigate the causes of malfunctions and server load.
Both Nagios and Prometheus are excellent tools for this purpose; choose the one that is better suited for your specific use case scenario.