HOW TO INTERPRET THE TOP COMMAND’S OUTPUT
- Server Administration
- 2,883 views
- Ingavar J.

The top command is one of the most common tools available to a system administrator. You can use it to troubleshoot CPU and memory usage, or as a general purpose application that allows you to monitor your system in real time.
Top can be a very complex command, we will review the most common options in this article.
The command is installed by default in most Linux distributions and can be launched by simply executing top from the command line.
If the program is not found, you can install it as part of several different packages. The most common method is to install the procps-ng package using your system’s packet manager.
UNDERSTANDING THE SUMMARY AREA
The upper section of the top command output is known as the summary area. It consists of 5 lines and displays very important information about your system.
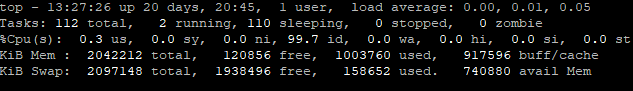
In the left half of the first line you can see the current time, the system’s uptime and the number of active user sessions.
The right half shows the load average, which is one of the most important stats of a Linux system. The three values represent the load averages for the last 1, 5 and 15 minutes and are often misinterpreted.
Without going into details, there are two important trends to watch in this section. If the one minute load is greater than the other two, it means CPU usage is increasing.
The load value itself can only be interpreted based on the number of cores available to your system. On a single-core system, a value of 1 means 100 percent processor use, so you have to divide the load value by the number of cores in order to understand it properly.
That means that for example a load of 5 is low (50%) on a 10-core machine but very high (500% usage) on one with a single core.
The second line shows the number of processes, divided into running, sleeping, stopped and zombie. A zombie process is one that has been completed but is still listed in the memory data tables. The presence of many sleeping processes is not unusual and doesn’t signal a system issue.
On the third line you can inspect CPU usage details. One important value here is wa, which shows the time spent waiting for I/O operations and might signal a disk problem.
Finally, the last two lines of the summary show memory and swap usage. This is very useful because sometimes a high CPU load is actually caused by the lack of free memory.
THE TASKS SECTION
The task section occupies most of the top command’s screen output and shows the details of a list of processes, in an order decided by the user.
The columns display:
PID – the unique process ID
USER – the user who started the process
PR – the process priority
NI – the nice value that determines priority
VIRT – the total amount of memory consumed
RES – the amount of reserved memory
SHR – the amount of shared memory
S – the state of the process
%CPU – the percentage of CPU used
%MEM – the percentage of total memory used
TIME+ – the duration of an active process
COMMAND – the process’ name
SORTING THE LIST
By default, top sorts processes ordered by their CPU usage, in descending order. Press R to reverse the order at any time.
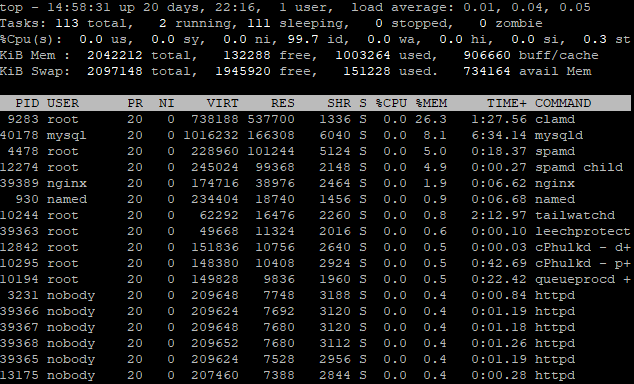
You can sort the list by other values interactively, the most common of the many commands available are to press M to order by memory usage, T to sort by running time or N to sort by process ID. Pressing P will display the list based on CPU usage again. The above screenshot shows a list ordered by memory use.
KILLING PROCESSES
If you notice that a process is using too many resources, you can kill it directly from the top interface.
![]()
Pressing k will open a prompt, insert the PID of the process from the list and press Enter. By default, the process on top of the current list will be killed if no PID is given.
OTHER USEFUL COMMANDS
Press c to show the full paths of the running processes, which can be very useful in troubleshooting. In this mode, kernel processes are placed between square brackets.
Another helpful option is the tree view that lists processes in a child-parent hierarchy. Press v to switch to this mode at any time while top is running.
Pressing u will open a prompt that allows you to specify an username, in order to filter only the processes that were started by that user.
Finally, you can press q or CTRL+C to quit top when you’re done.
The top command has many other flags and options, we only went through the basics in this article. You can run man top from the command line for an exhaustive list, but you should already know how to make the most of this tool in order to troubleshoot your system.