Query Monitor – Debug WordPress and Improve Website Performance
- WordPress
- 3,905 views
- Icarus M.

Imagine this scenario: You’re working on a WordPress development project and have a dozen or more plugins installed. However, your site isn’t humming along quite the way you’d like it to. You’ve eliminated all of the usual suspects: hosting is adequate, there are no obvious JavaScript or PHP errors, and there is nothing else clearly amiss. You suspect that one or more of the plugins you’ve installed are to blame, but how do you figure out which plugin is causing the problem?
The usual method of identifying a troublesome plugin is to deactivate plugins one-by-one until the behavior you’re trying to address stops. However, with the right debugging plugin installed, you can pinpoint the issue more quickly and with greater accuracy. This is the sort of scenario Query Monitor was made to resolve.
- What is Query Monitor?
- What does Query Monitor Do?
- How to Use Query Monitor
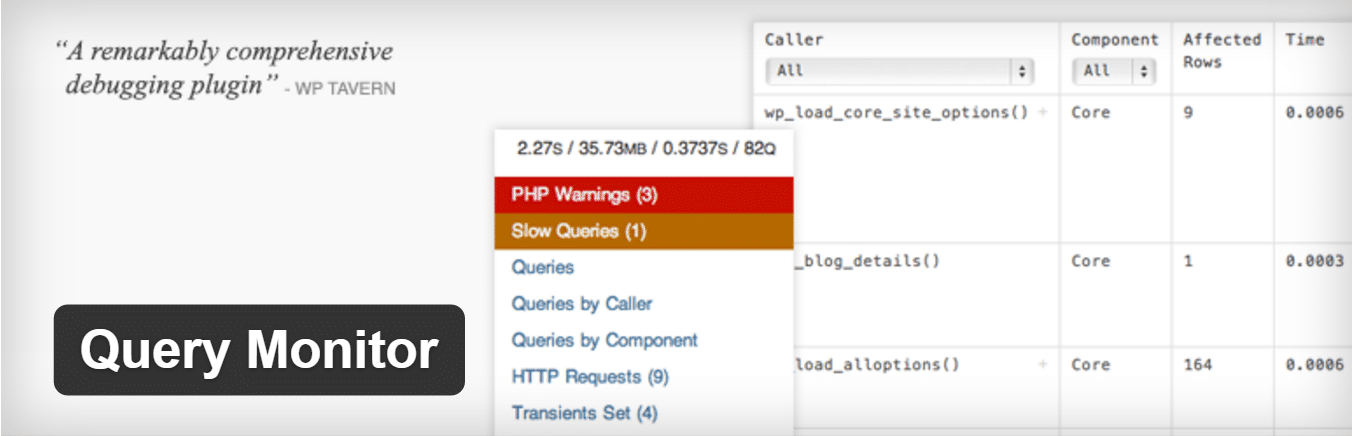
What is Query Monitor?
Query Monitor is a free debugging and development plugin for WordPress. You can use it to identify and debug slow database queries, AJAX calls, REST API requests, and much more. In addition, the plugin reports back website details such as script dependencies and dependents, WordPress hooks that fired during page generation, hosting environment details, conditional query tags met by the current page, and a lot more.
The plugin was developed by John Blackbourn, a core WordPress committer who is currently a developer at Human Made and was previously employed by WordPress.com VIP — in other words, someone who really knows WordPress. Query Monitor was added to the WordPress plugin directory in 2013 and currently boasts more than 10,000 active installs – an impressive sum for a development plugin. The plugin’s user rating of five out five stars helps explain it’s popularity among developers.
What does Query Monitor Do?
A lot.
We won’t take the time to list every feature offered by Query Monitor, but if you want to dig into the details take a look at Query Monitor on GitHub. At a high level, what Query Monitor does is watch every WordPress transaction that takes place on the server, or between the server and visitor’s browser, while a WordPress webpage is generated. It then appends a report to the footer of the webpage detailing all of the information it has gathered. It works on every page, including /wp-admin/ pages, so you can use it debug any front end or back end page.
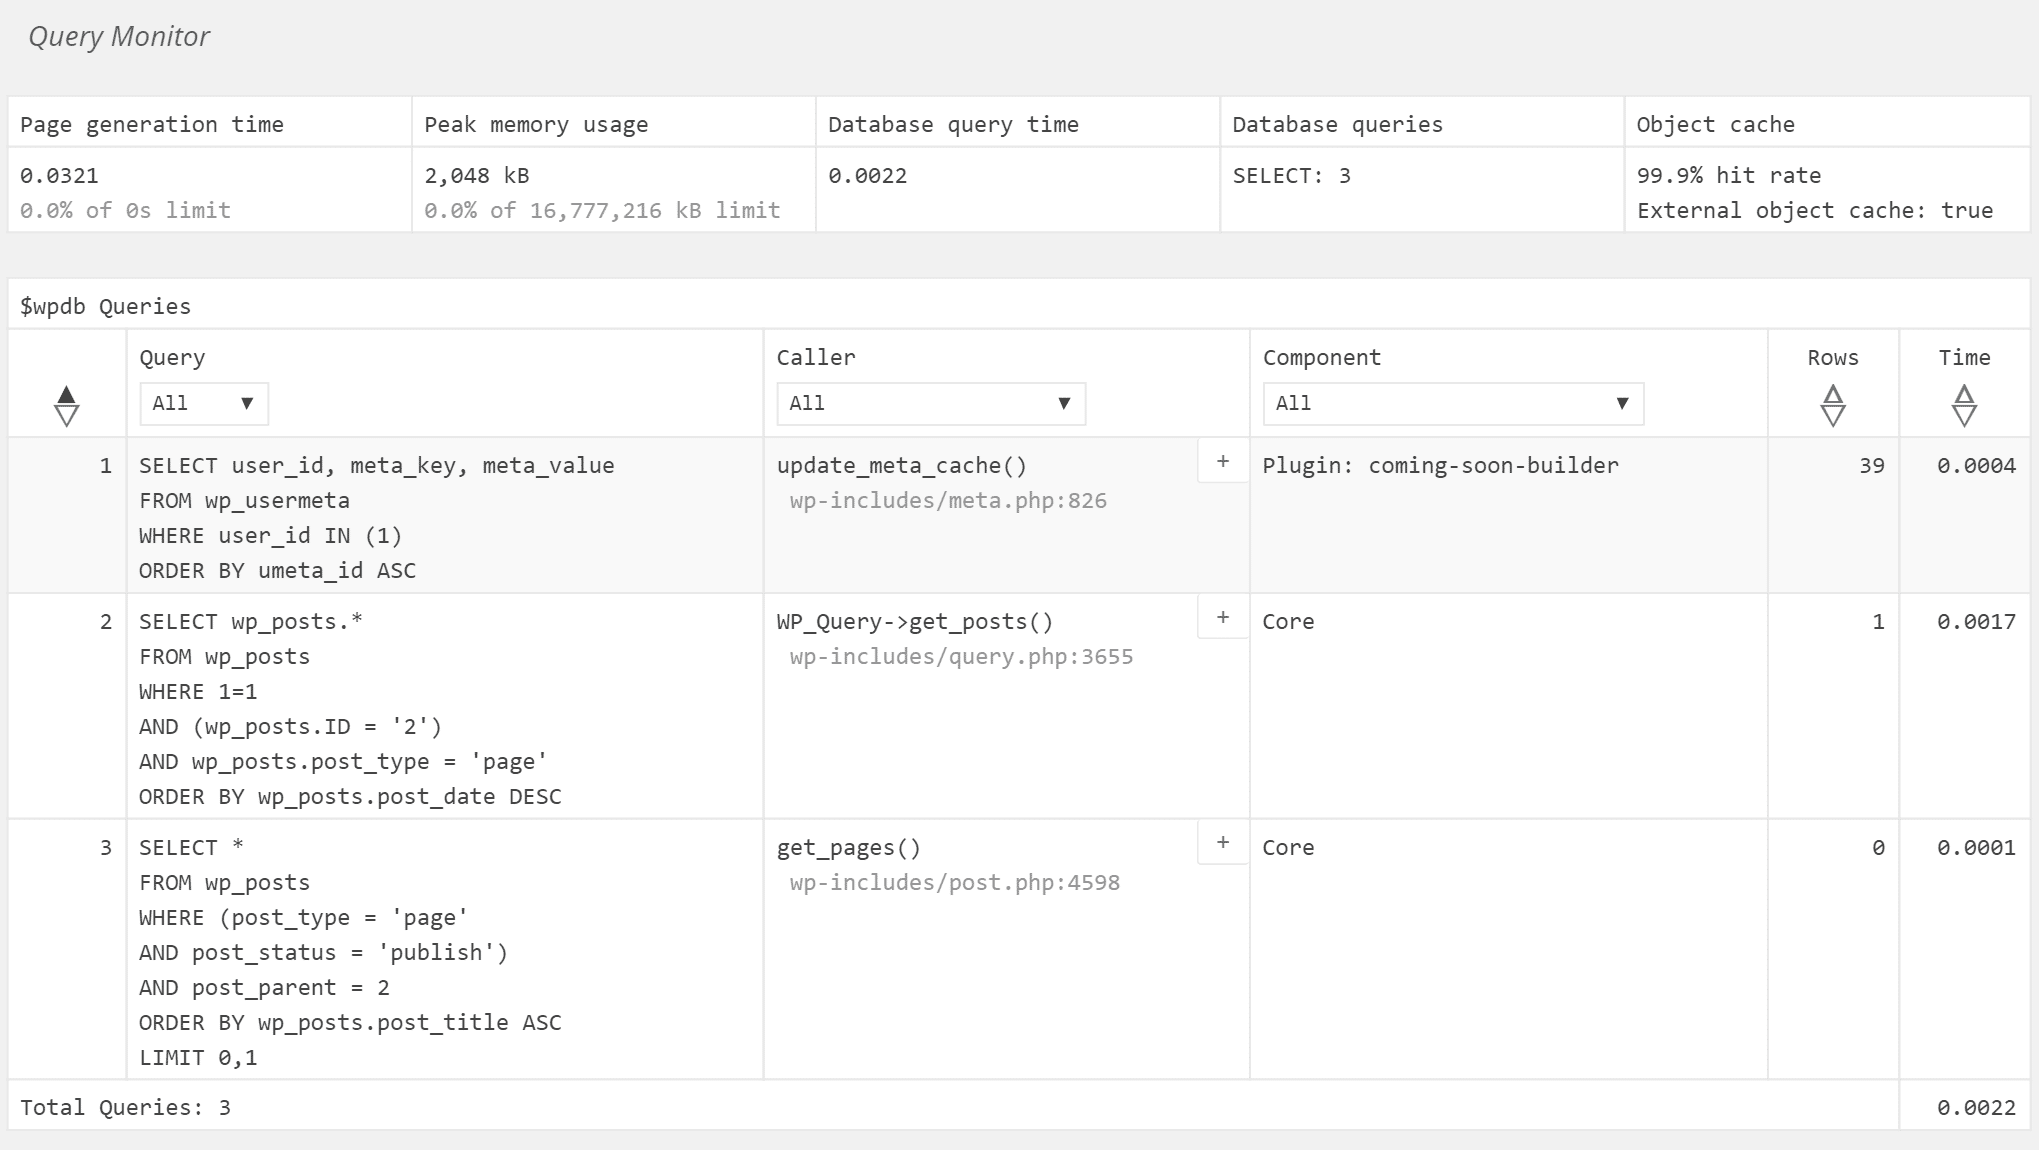
The plugin is named after a core feature: monitoring of database queries. Each query is monitored, timed, and tied back to the function that generated it. As a result, you can sort queries based on how long they take to process and pinpoint problematic, slow-loading queries.
Query Monitor also tracks and lists the WordPress hooks and conditional tags application to the generated page. As a developer, you can use this information to identify the right hook or conditional tag to use when adding new plugin or theme functionality.
Query Monitor provides a lot of additional information. The best way to get a handle on everything generated by Query Monitor is to install it on a test site and take a look at the reports.
How to Use Query Monitor
Install Query Monitor using your preferred method: it’s on GitHub and also available from the WordPress plugin directory. Once you install the plugin, the first thing you’ll notice is that a new menu item has been added to the admin bar:
The label on the new item displays a few metrics:
- Page generation time,
- Peak PHP memory usage,
- Database query time, and
- The total number of database queries made.
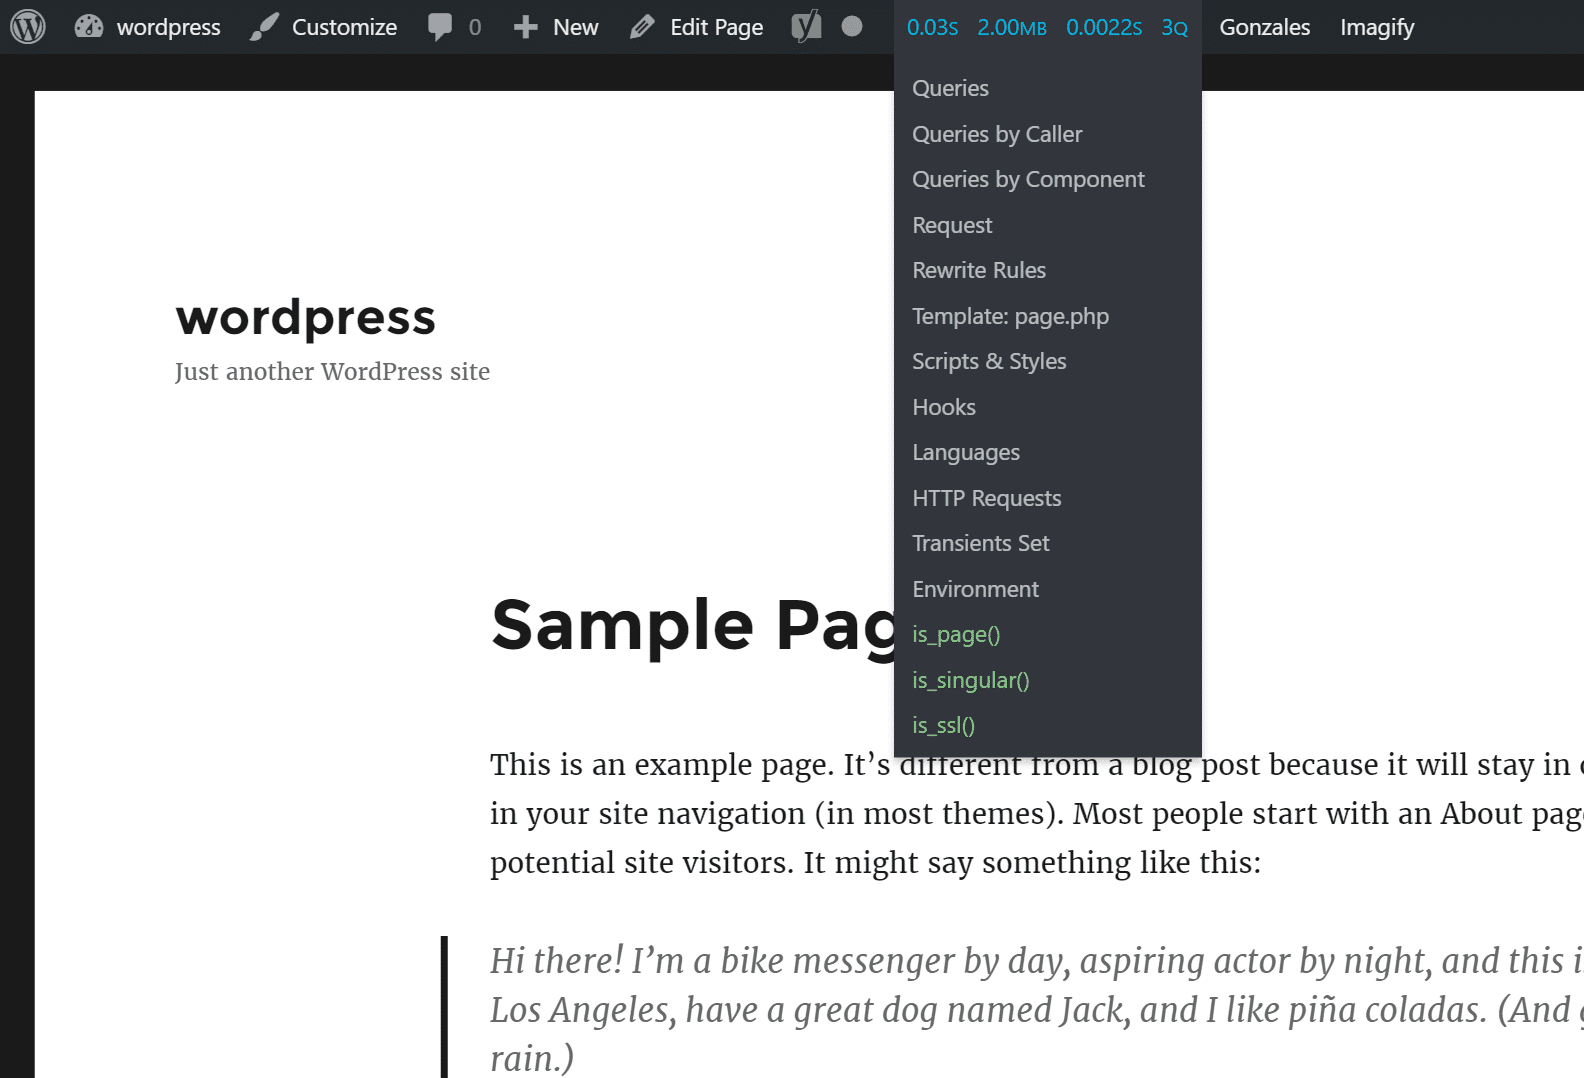
Hover over the admin bar and a drop-down menu will appear. All of the data generated by Query Monitor is contained in a single report added to the foot of the page and broken into multiple sections. Click on any of the items in the drop down menu to be taken to the corresponding section of the Query Monitor report. For example, below is a screenshot from the overall “queries” that are running on the page.
If any PHP errors occur, or if any queries take too long, additional items will be added to the drop-down menu highlighting those problems. Click on them to see more details.
You may notice that the last few items in the list change from one page to the next. These items, shown in green, are the conditional query tags satisfied by the current page.
Scroll through the entire report to see the wealth of data generated by Query Monitor. Take the time to try out the drop down menus available to filter data contained in the report as well as the boxes containing a “+” symbol which can be used to view more data about many reported details.
If you want to get even more data out of Query Monitor take a look at the third-party Query Monitor add ons to see if a plugin exists that will generate the debugging information you need.
How to View Query Monitor Data as a Logged Out User
When you view a WordPress website while logged in as an admin, the site contains an admin bar and additional scripting that logged-out visitors don’t see. Query Monitor makes it possible to view the site while logged out and still have access to debugging information. However, using this feature for the first time can be a little tricky.
To view Query Monitor data as a logged-out visitor, follow these steps:
- Go to the WordPress admin area while logged in as an admin and click the Query Monitor item in the admin bar.
- Scroll the very bottom of the reported data and look for the link that says Set authentication cookie. Note that you must be in the admin area to see the link. If you look for the link on a front end page, you won’t find it.
- Clicking that link will add an authentication cookie to your browser. That way Query Monitor will know to display test results even if you aren’t logged in.
- With the authentication cookie set, log out of the site or switch to a non-admin user profile using a plugin like User Switching.
- Navigate to the page where you want to see debugging information and scroll to the bottom of the page. There you’ll see a condensed version of the Query Monitor report. Click on any item to expand the report.
Summary
As a WordPress developer, having the right tools can make your job easier. Query Monitor is a free tool with the potential to save you a lot of time. You can use it to:
- Pinpoint slow queries and the functions that trigger them,
- Generate a list of the WordPress hooks encountered while WordPress was generating the page,
- Confirm which conditional tags apply to the current page or post,
- Identify the relationships between JavaScript resources,
- Have a look at server configuration details, and